
|
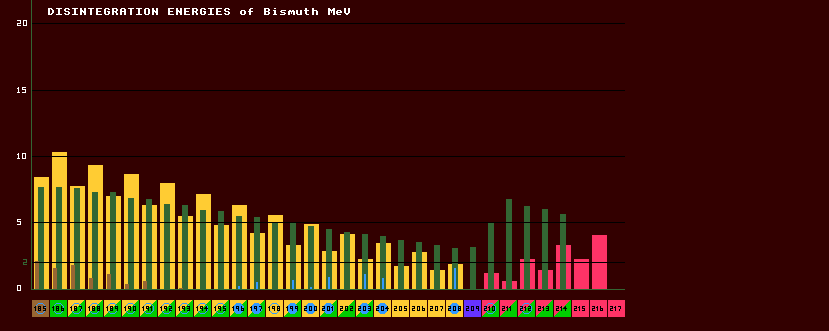
The disintegration energy (or Q-value) is the difference in mass that will be released as energy from the parent after taking into consideration the mass of the daughter product and any emitted particle. Most of the disintegration energy goes into giving the emitted particle kinetic energy, but some may be released as gamma rays. The disintegration energies are colour coded red - beta; yellow - inverse beta; brown - proton; pink - neutron; and green alpha. Disintegration energies liberated by Internal Transition from a metastable state to the ground state are shown by solid cyan lines.
The colour-coding of the histogram bars is based on the theoretical decays of the isotopes; those decays that are energetically favoured by reason of their isotopic masses. These may well be different from the observed decays, (by which the isotope boxes below the chart are colour coded). There are a number of reasons for this. In the case of alpha decays, the mass difference has to exceed about 2MeV before the halfife of the isotope becomes sufficiently short (less than about 1012 years) for the decay to be frequent enough to be observed. Therefore, observed alpha particles will have at least 2MeV energy. The graph line at 2MeV earmarks this. In the case of inverse beta decays, if the atomic mass difference between parent and daughter is in-sufficient to produce an emitted positron, then electron capture will be the only mechanism possible, and there will be little or no disintegration energy. This is the essential difference between this chart and the RELATIVE MASS cameo of the program !Isotopes, which shows the isotopic mass differences only. Note that alpha in-stability arises in the periodic table firstly in isotopes on the proton-rich side of the beta/inverse beta line of stability, and that the disintegration energy reduces smoothly as neutron number increases. Higher up the periodic table, small hillocks in the alpha disintegration energy appear, especially in the region of polonium to actinium. Note the change by element. The above diagram shows the nuclear disintegration energies for bismuth. Note how the disintegration energies decrease the more stable the isotope, and the nearer it is to the valley of stability (the beta/inverse beta watershed). On the far left, three disintegration energies are shown for bismuth-185, the proton disintegration energy (brown bar, 2 MeV), the disintegration energy for alpha decay (7.5 MeV, green bar), and the inverse beta (positron emission) decay energy (yellow, 8 MeV). On the far right, that for bismuth-214 shows alpha decay at 6 Mev (green) and beta decay at 3 MeV (red). Whilst in the middle, the metastable disintegration energy of bismuth-203 is 1.3 MeV (narrow, cyan bar).
|
![]()