 |
 |
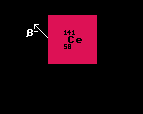
 Unstable to beta decay |
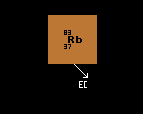
 Unstable to electron capture decay |
 |
 |
 Unstable to beta decay |
 Unstable to electron capture decay |
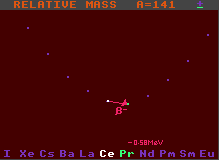
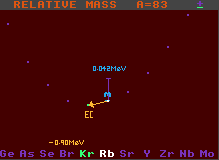
The graph at the bottom of the Segre chart displays the masses of seven isobars (nuclides with equal mass, but of different elements) relative to that of the selected nuclide (shown in white in the middle). This is part of a diagonal section of the Segre chart, and shows the stability against beta- or inverse beta-decay. The difference in mass of the surrounding nuclides is readily seen. Nuclides with lower relative mass are depicted in green, while those with higher are shown in blue, together with the mass difference (measured in MeV). Nuclides with higher mass can decay into those with lower mass by emitting an electron (Beta decay) or a positron or electron capture (inverse beta decay/electron capture), releasing most of the difference in mass as kinetic energy. Generally, the greater the mass decrease, the shorter the half-life.

![]()

![]()
![]()