 |
 |
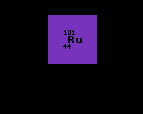
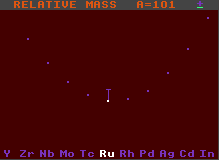
 Stable against alpha decay |
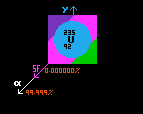
 Unstable to alpha decay |
 |
 |
 Stable against alpha decay |
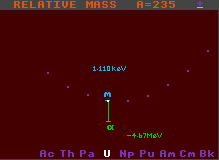
 Unstable to alpha decay |
Generally, the longer the green line, the greater is the kinetic energy imparted to the emitted alpha particle, although some of this energy is taken up by recoil velocity of the daughter product. (Note that the end of the green line does not represent the daughter product, that is two elements to the left hand side and four units of atomic weight, A, less, and hence cannot be properly represented on the same chart).
Note also that not every nuclide which is unstable to alpha decay is declared as such on the colour coded Segre chart, probably because the alpha decay is either extremely infrequent (i.e. of very long halflife) or the branching ratio for the alpha decay route is very much less than that for the other route(s) shown.

![]()

Both the above examples are stable to beta/inverse beta decay, but this is not a requirement for alpha decay, it just made the diagram clearer to chose one stable to beta/inverse beta decay.
![]()
![]()