WMAP MICROWAVE ANISOTROPY SPHERICAL PLOTS


[ISPL]
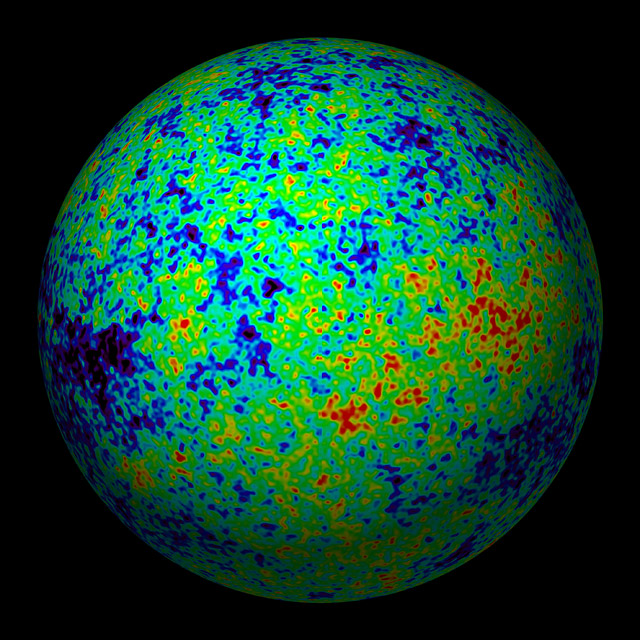
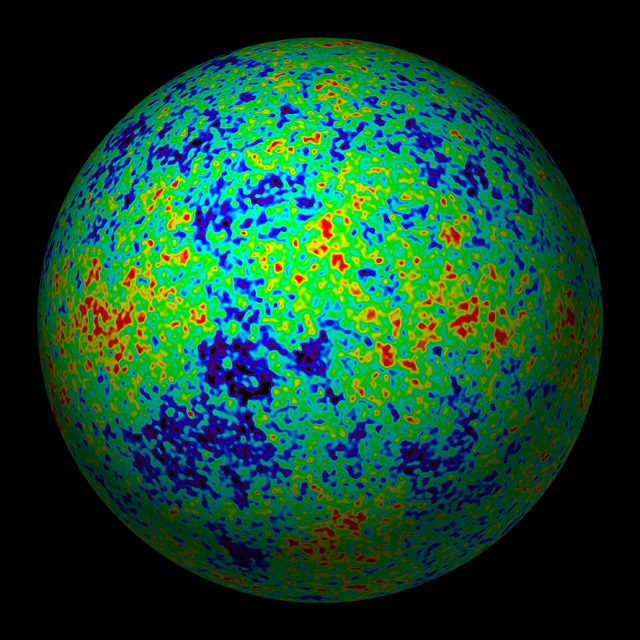
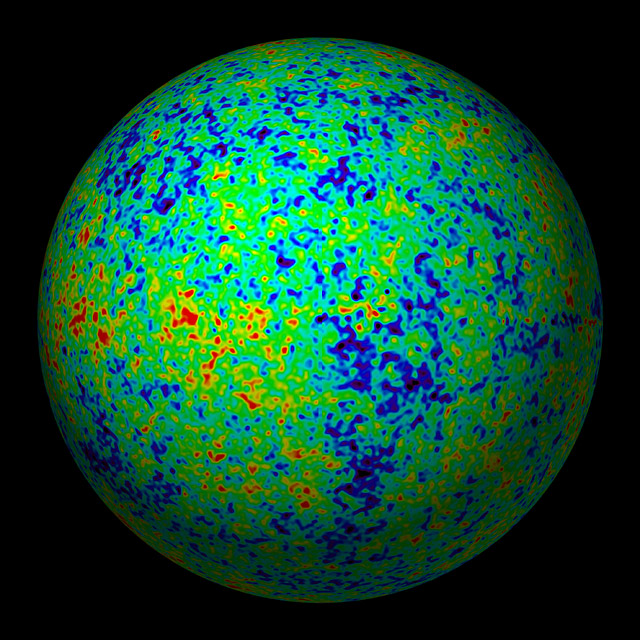
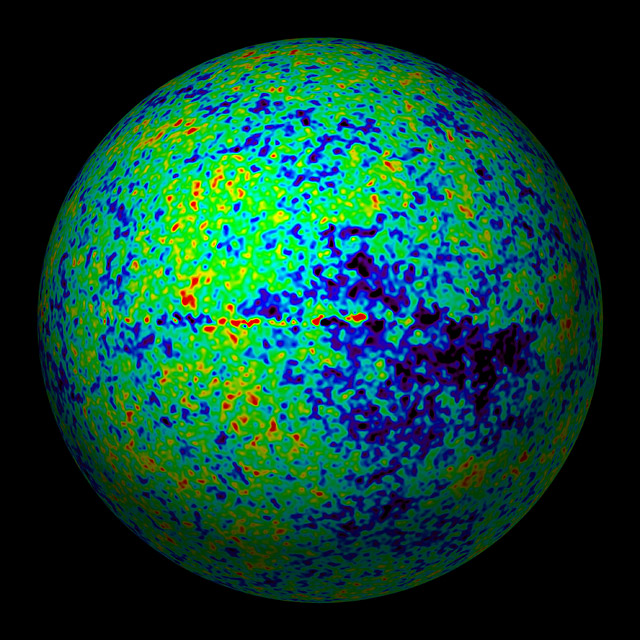
Four views of the WMAP data as presented on a sphere. Puzzlingly, the data shows that there are large-scale quadrapole and octopole components to this temperature difference map of the microwave background radiation. The quadrapole component, of two hot-spots and two cold-spots in the data, is aligned with the solar system; one vector of which is nearly perpendicular to the plane of the solar system, the other vector is aligned with the direction of movement of the solar system through the Universe. Similar alignments also apply to the octopole components. This makes the data suspect: how can the data be dependant upon the co-ordinates of our solar system when it is supppsed to be a map of the temperature variations in the Universe as a whole. Another group of researchers has found that the temperature maps are noisier in the Earths' southern hemishere sky than in its northern hemisphere sky, again making the data slightly suspect.

The distribution of temperatures as shown will also be influenced by the gravitational lensing of any intervening galaxies or large masses, since The Cosmic Microwave Background signal has come from the furthest reaches of the Universe, when it was only about 300,000 years old. Thus the four views of microwave anistropy could have errors caused by gravitational lensing. This error can be eliminated by observing the whole-sky in the 21cm wavelength, the Hydrogen line radiation. The 21cm Hydrogen line occurs at a frequency of 1420Mz, and is the frequency at which the spin of the electron in neutral hydrogen atoms continually flips between being parallel to the spin of the proton nucleus and being anti-parallel to it. Since this 21cm radiation will, being distant in origin, be affected to the same degree by gravitational lensing. This work is only just getting started using the LOFAR array of radio-telescopes in the Netherlands (Nov 2005).