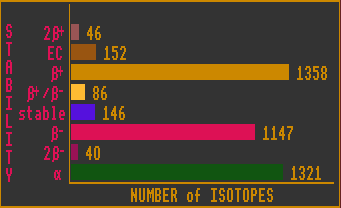
STABILITY STATISTICS
The chart above shows the total number of nuclides which are unstable to various decay routes. Unlike the previous charts which are based on decay mode observations, the calculations here are based on atomic masses, and thus represent their theoretical decay modes, hence differences may be apparent. Because of bimodal and multi-modal decays, some nuclides are counted twice or more. All nuclides subject to inverse beta decay are also subject to electron capture, but these are not shown on the electron capture, EC, bar. The nuclides shown on the EC bar are those whose mass differences are too small to emit an electron (less than two electron masses) and can decay by electron capture only. [On the other hand, the Double Inverse Beta decays (2 ) includes contributions from both 2EC and 2
 ].
].
Note that the number of stable, dual mode Beta/inv Beta, Electron capture and Double Beta or Double inverse Beta is likely to remain much the same as the Segre chart is explored to higher and higher energies. The same is not true for the number of Beta or Inverse Beta isotopes, which is likely to keep increasing.


![]()