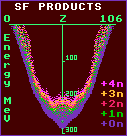

The five graphs are charts showing the energy liberated by the various combinations of the two decay fragments. The charts are necessarily symmetrical. It seems that for the very heaviest nuclides, the most energy is liberated by splitting into two fairly equal fragments, as in Hassium-264, shown above; notice here the two stalactite-like spikes at Iron-56 and Lead-208. For lighter nuclides, there is a slight bias towards 47%:53% splitting as is evident in Plutonium-242. For yet lighter nuclides, there are positively forbidden splittings covering a wide ±5% band centred on 25%:75% unless more than three neutrons are also emitted, as in Curium-246. Notice that there is a much smaller, but not insignificant, liberated energy for light:heavy splittings, this includes alpha decay, but others involving Carbon-12 or Oxygen-16 emission may be more likely.
![]()