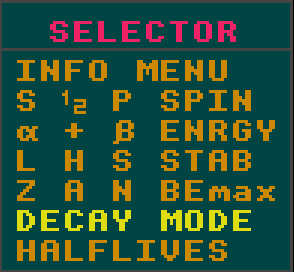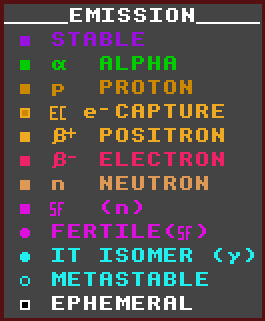


In the program !Isotopes (not here in !IsotopeInfo) the Segre Chart display mode is changed using the available options in the SELECTOR BOX. For further Information on all the available display modes as shown above, see the HELP MANUAL FOR !ISOTOPES. The display mode shown here is the (default) DECAY MODE.

|
| (stable) | ||
| alpha particle (helium nucleus) | ||
| proton | ||
| (electron capture) | ||
| positron (anti-electron) [inv Beta decay] | ||
| electron [Beta decay] | ||
| neutron | ||
| spontaneous fission (with neutrons) | ||
| | metastable state that decays by SF (fertile isomer) | |
| | metastable state that decays by internal transition (IT) [gamma] | |
| | metastable state that decays by alpha, B+ or B- (by a route as shown by the colour code within the ring) | |
| (ephemeral) extremely short halflife |
As a reminder, all nuclear decays are usually accompanied by incidental gamma rays, not shown in the chart.
It is important to realise that the colour coded decay modes in this chart are derived entirely from the decay modes data and NOT from the atomic mass data, as used in the charts of HIGHEST BINDING ENERGY or LEAST MASS ISOBARS (L H S STAB or Z A N BEmax display modes). That is, the decays shown are actual observed decay modes. Some theoretically possible decay modes are not shown here because of their very low probability of occurance, or because they are overwhelmed by other decay modes.
This is also true of the RELATIVE MASS chart. The decays shown by arrows on this chart are derived from the decay data only, and not from the mass data. However, when the program is switched to any other mode display other than DECAY MODE, then the decay arrows depicted are derived from the MASS data, and not from the decay data.
![]()
![]()