
|
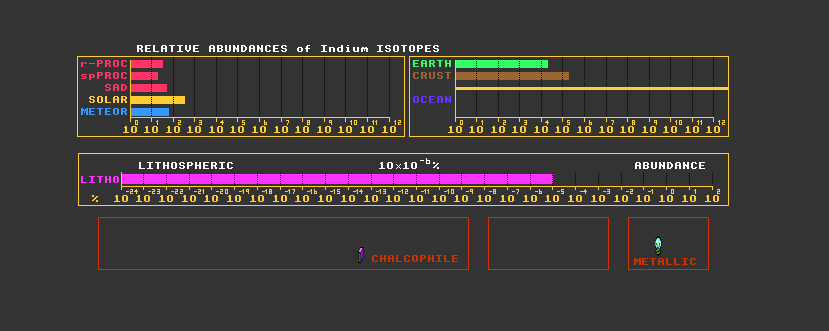
HELP on RELATIVE ABUNDANCES This chart shows the relative abundance of the element in selected locations. All charts cover a range extending over 12 orders of magnitude except for the LITHOSPHERIC ABUNDANCE which covers a massive 26 orders. The lithospheric abundance is measured in percent. Only charts bounded by boxes can be directly compared. Thus the SOLAR abundance can be directly compared with that of the CARBONACEOUS METEORITEs, the SAD (STANDARD ABUNDANCE DISTRIBUTION), the r-PROCESS and the sp-PROCESS abundances, which are all measured in atoms per 1012 of hydrogen.
The WHOLE EARTH abundance is directly comparable with the CRUSTAL abundance, (both measured in ng/kg [in the rest of the program, they are measured in The OCEANIC and HUMAN abundance are normalised to the abundance of calcium, which is roughly the same in both environments. So that this can be done, the scales have been adjusted such that the human abundance is here measured in picograms/kg body weight and the oceanic abundance is measured in 10-12 mol/kg. Other icons show geochemical classification, incidence and metallic classification. For further information, please refer to their respective help files.
|
![]()